View Topology
The P4Admin Topology tab is a Technology Preview feature introduced in 2021.4.
Features offered in Technology Preview are experimental and not guaranteed to always work as expected. If you have feedback and functionality suggestions, email [email protected].
|
The Topology tab displays a graph of all the connected services in your multi-server deployment. To zoom in or out, use the mouse wheel. You can drag the nodes to a different arrangement, and the graph "remembers" your arrangement the next time you open P4Admin. If a new node is later added to your topology, the entire graph will be redrawn with the default arrangement, but you can still rearrange the nodes. The Topology tab includes filters, such as:
|
|
-
This is a graph of services, not of servers. A given server might provide one or more services. A given service might be associated with one or more IP addresses.
-
The Topology tab is available for use if both are true:
-
P4Admin is connected to a server running Helix Core (P4D) version 2021.2 or greater
-
you are a user with the
superpermission level
-
If you want to send the topology data to Perforce Support, click the Copy data to clipboard button, save the data to a file, and upload the file in a Support Request.
For information about the underlying Helix Core command, see p4 topology in Helix Core Command-Line (P4) Reference.
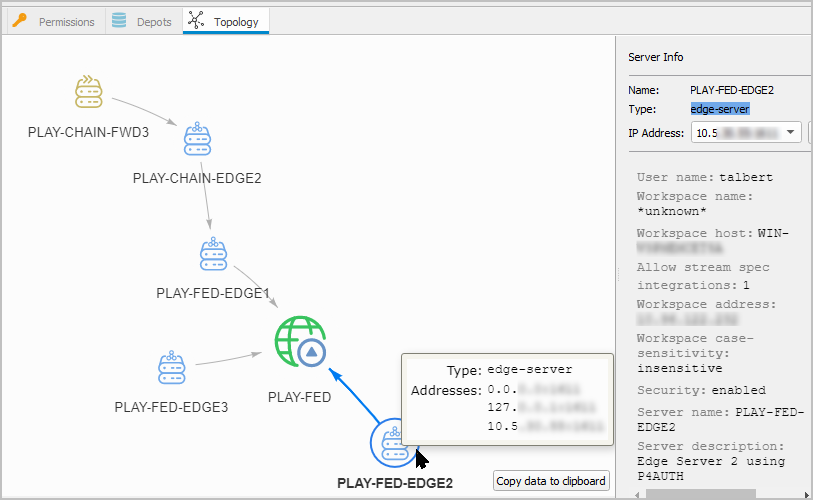
In this example, the graph is anchored by the service associated with the ServerID "PLAY-FED", which is of type commit-server
To get basic information about a particular service, hover the mouse over that service. A tooltip pops up to show the service type and the IP address(es) it is listening on.
To get additional information about a particular service, click its icon to display the Server Info detail panel
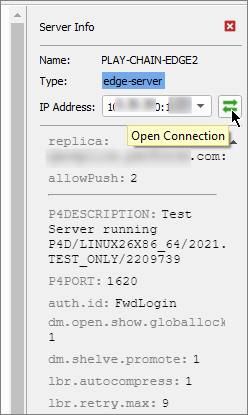
This shows:
-
the
ServerId"Name" associated with the selected service, as well as the service type -
a list of the IP address(es) associated with the selected service
-
the output of the p4 info command, followed by the settings of the Configurables for that service
-
the Open Connection button that allows you to add that server to the list of Connections and work with that connection in P4Admin
Icons
Each service type has its own icon.
| Icon |
Type of Server |
|---|---|

|
commit-server |

|
standard |

|
edge -server |

|
replica |

|
forwarding-replica |

|
standby |

|
forwarding standby |

|
build-server |

|
proxy |

|
broker |

|
unknown, which means one of the following:
|
Known limitations
-
A service cannot be permanently removed using the graph functionality, even if the server that ran that service has been decommissioned. However, the
Last Seen Datefilter allows you to hide old records, and this feature can hide decommissioned services.-
To permanently remove records from displaying on the graph, see Examples of deleting records under
p4 topologyin Helix Core Command-Line (P4) Reference. -
To monitor a server, see p4 monitor realtime in Helix Core Command-Line (P4) Reference.
NoteIf a server is down, the "Server Info" detail panel will lack the data from p4 info, even if the graph still shows the service(s) associated with that server.
-
-
If a service changes any of its IP addresses, that service will be associated with both the former and the current IP addresses. However, the
Last Seen Datefilter allows you to hide old records based on timestamp, and this feature can hide a service associated with a time before the current IP address came into effect.
-
To be visible, a service must have a
ServerID. See p4 serverid in Helix Core Command-Line (P4) Reference. -
The following do not appear: Helix Swarm, centralized authorization server (P4AUTH), Centralized changelist server (P4CHANGE), Helix4Git git-connector


