Blog
May 7, 2017
4 Metrics for Video Game Project Management

Digital Creation & Collaboration,
Project Management
What makes video game project management different from managing other projects? What metrics should you cover to be successful?
We'll focus on what a Senior Producer on an AAA Game Development project will need to deliver, so they can ship high-quality games on time and on budget.
Back to top#1. Will We Hit Our Milestone?
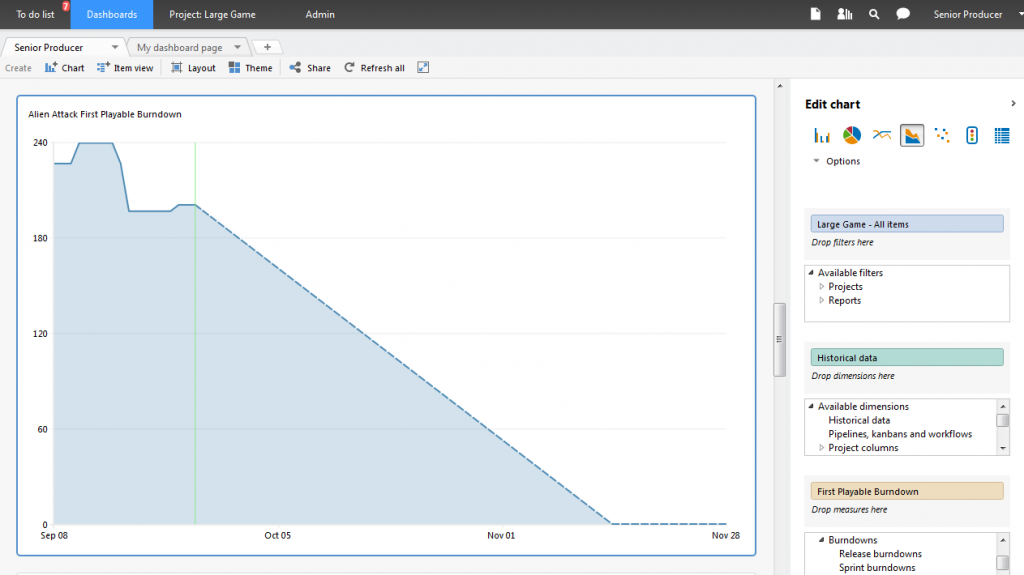
After all the pre-production brainstorming, designing, and planning, every Senior Producer asks themselves, “Will we hit our first milestone?” Whether it’s a First Playable or a first full Production milestone, it’s important to know ASAP if the team has bitten off more than they can chew. The most clear and concise answer to the question is provided by the Milestone Burndown chart.
Tag Your Milestones
The first step in getting an accurate milestone burndown for video game project management is to make sure you tag all work to the relevant milestone. This includes your product backlog and schedule.
Whenever you create a milestone in P4 Plan (formerly Hansoft)–– the Agile planning tool from Perforce –– you then have the ability to tag both Product Backlog items and entire sprints or scheduled tasks to that milestone. Simply right-click the items and select “Tag to milestone / release”.
Review Historical Data
Once completed, creating the Milestone Burndown chart in a P4 Plan Dashboard is done by selecting the entire Project as the filter, Historical data as the dimension and Milestone/Release burndowns as the measure.
To display the specific Milestone, right click the measure and choose “Select milestone/release burndown”. Finally, to display a dotted-line prediction of when the committed milestone work will be completed, based on currently team velocity, click on the Historical data dimension and choose “Forecasting settings”.
 Back to top
#2. Are Feature Teams/Areas Tracking Toward Completion?
If you have your product backlog structured by feature team (always a good best practice), you’ll be able to see burndowns specific to each feature area. It'll be easier to see how different feature areas are tracking towards completion relative to each other.
How to Track Your Feature Teams
Once again, choose the entire project as a starting filter and Historical data as your dimension. Your measures will depend on whether you’re using Points or Estimated Ideal Days to size your product backlog.
Point Estimations
If you’re using Points, then drag and drop Points not done into the measure multiple times – equal to the number of feature teams you have on you project.
Day Estimations
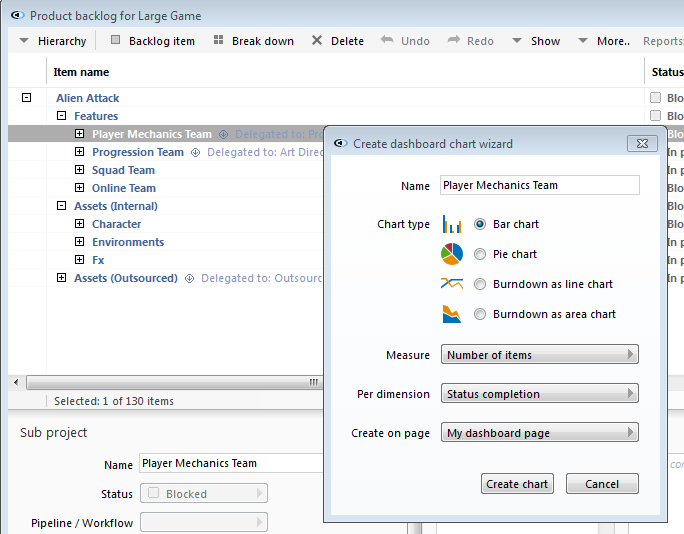
If you’re using Estimated Ideal Days, then do the same instead using Estimated days not done. You’ll need to apply a filter to each of the measures in order to represent the specific feature area. The easiest way to create these filters is to open the project’s Product Backlog, right click the top-level parent of each feature area and select “Create dashboard chart…”.
Creating any dashboard will automatically create a report that carves out just that section of the backlog. In the example below, the automatically generated report will have a title identical to the selected feature area: “Player Mechanics Team”.
Use Dashboards to Evaluate Velocity
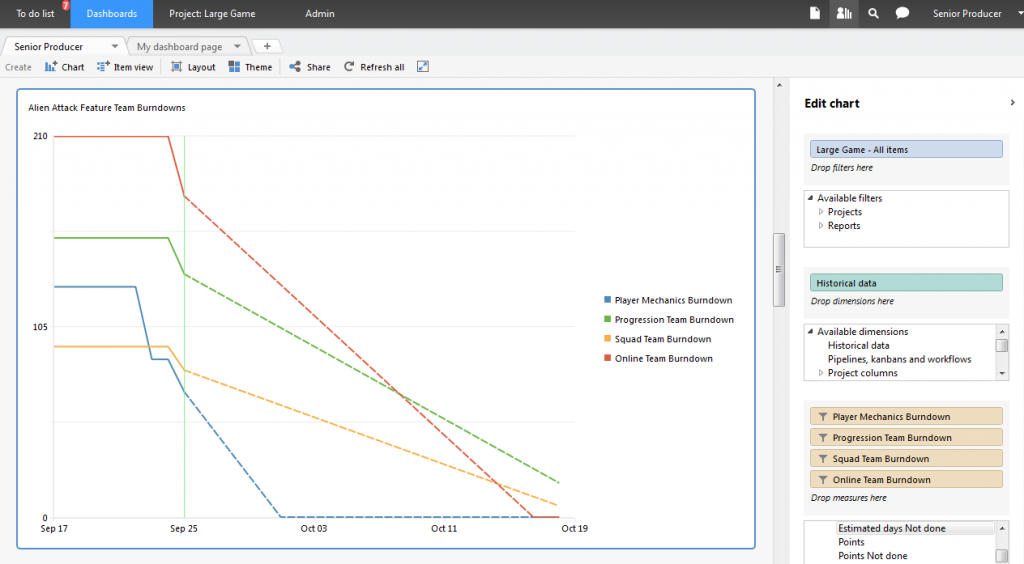
Once you’ve created a report filter for each feature area, navigate back to your dashboard. Click on each of the measures and select Filter to apply the appropriate report. Finally, to display a dotted-line prediction of when each feature team’s work will be completed, based on each team’s current velocity, click on the Historical data dimension and choose “Forecasting settings”.
This will create multiple burndowns on the same chart, indicating the teams’ current burndowns and completion date predictions, as seen in the example below.
Back to top
#3. What Does Our Milestone/Release Plan Look Like?
P4 Plan's Dashboard functionality can provide you with an excellent visual representation of your milestone/release plan. Plus you can easily share it with anyone on your team.
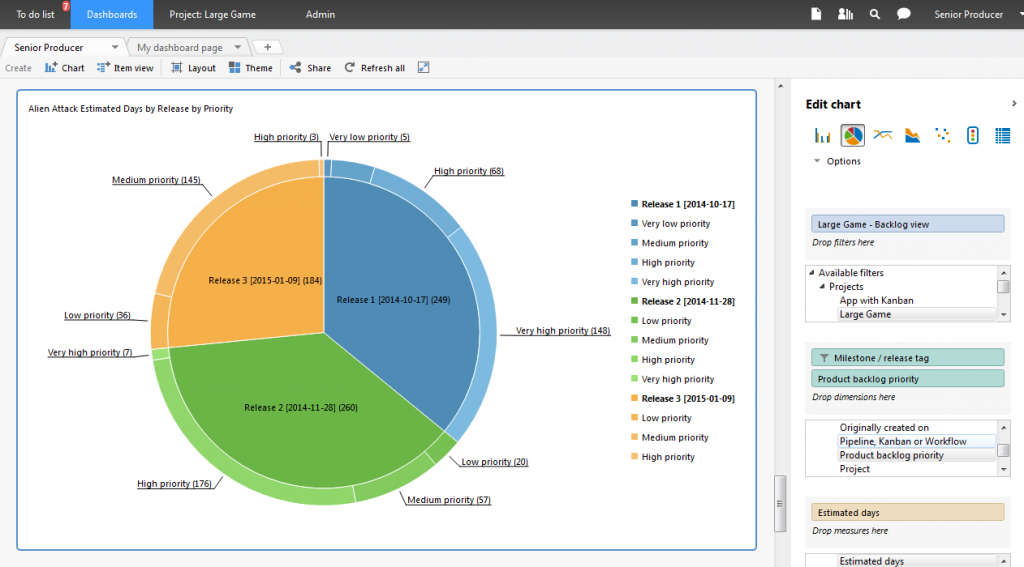
The below example shows the distribution of work tagged to each milestone/release and an outer ring representing Backlog priority. This will help you to determine if you have an even distribution of work from milestone to milestone. It'll also help ensure that the majority of high-priority items are being completed sooner not later.
Create and Share Dashboards
To create this chart, select the project’s backlog view as the filter. Select milestone/release tag as your first measure. Be sure to filter down to the release you’d like to view. Drag and drop Production backlog priority as your second measure, which will create the outer ring on the pie chart. Finally, choose either Estimated days or Points as your measure, depending on which you use to size your product backlog.
 Back to top
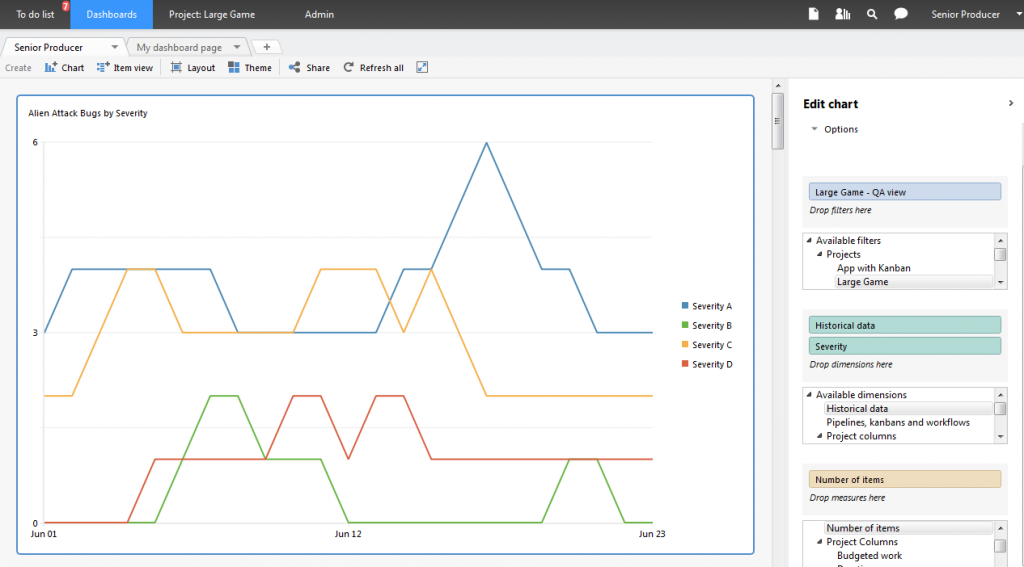
#4. How’s Overall Game Quality?
One way to get a view into overall game quality? Look at bugs over time by severity. While you work toward a sustainable zero bug count (and as you continue to triage, fix and known shippable bugs), this graph of historical bug data can be invaluable. It can ensure that you’re trending in the right direction.
Evaluate Quality Using Historical Data
By using forecasting, you’ll also be able to predict at what point you’ll reach the all-important zero bug count. To create this graph, select the project’s QA view as a starting filter. The dimensions will be Historical data and Severity. The measure is simply Number of items. As with all graphs using Historical data as a measure, a specific date range or rolling period of time can be specified by clicking the Historical data measure and selecting Set date range.
 Back to top
Better Video Game Project Management Starts Here
These are four straightforward examples of dashboard charts and graphs that can help any senior producer track, measure, and take action.
READ MORE EXPERT TIPS ON MASTERING GAME PRODUCTION >>
As you can imagine, there are many, many more important metrics in the game development process that can be visualized in P4 Plan, both for the Senior Producer role and other video game development roles.
Be wary of creating an overwhelming “cockpit” of visual noise. It is best to display no more than four — possibly six at most — charts and graphs on a single dashboard page. That way you'll be able to focus on the most critical elements of the project, based on the current stage of production.