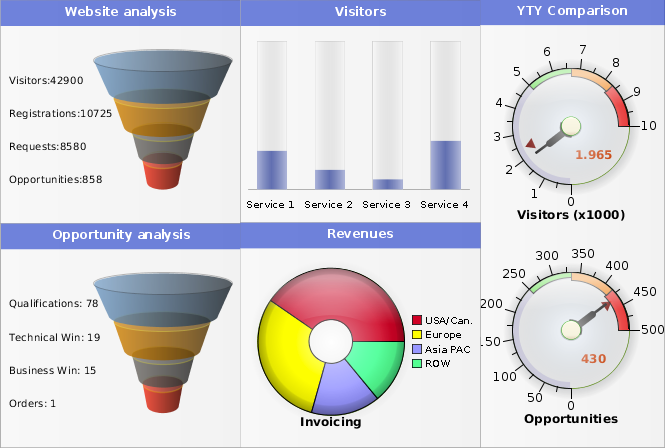
The following is an interactive, web based Java Server Faces Charting demo built with JViews Enterprise.
How to Use This Demo
This example demonstrates the different JViews Charts Faces components. It consists of three parts:
- At the top, a toolbar to set interactors or to carry out actions on the chart such as zooming.
- In the middle, the different views: chart view, overview and legend view.
- At the bottom, several inputs for configuring the chart.
Configuring the Chart
To configure the chart:
- Select one of the data sources provided in the dedicated dropdown list.
- Select a style sheet to apply to the chart from the dedicated dropdown list. This style sheet customizes the chart rendering. Various style sheets are provided to illustrate the different renderers available.
- Select the chart type from the dedicated dropdown list.
The Hide Legend checkbox allows you to display either the whole chart or only the chart area (without the legend).
Interact with the Chart
To interact with the chart, select an interactor from the toolbar and carry out an action on the chart.
Sets the zoom interactor that allows you to drag a rectangle over a specific part of the view to zoom in on it.
Sets the pan interactor that allows you to pan by dragging the view.
Zoom and pan can be constrained to a specific axis using the dedicated checkboxes at the bottom of the page.
The highlighting feature of this sample requires a browser with SVG or VML support, such as Firefox or Internet Explorer.
You can also trigger actions on the chart using the following toolbar buttons:
Zoom in on the chart along the x or y axis.
Zoom out of the chart along the x or y axis.
Fit the chart to display the entire data range.
Get Started With JViews
Contact us today to speak with an expert about getting started with JViews Java visualization software.