How SPIE Sud-Est Manages Today's Challenges and Predict's Tomorrow's With Visualization

SPIE manages infrastructure projects for over 5,000 groups with the design and development of their local, regional, and European projects, as well as maintenance and upgrades for their facilities. Across seven divisions with 2,500 employees in 46 locations, SPIE Sud-Est specializes in industrial services, mechanical services, heating, plumbing, and ventilation, as well as transportation systems.

The SPIE team modeled their project using the Server component of Visualization, limiting the amount of time spent handling the back-end work. And the development process was streamlined by using pre-built GUI components found in Visualization for C++ (Views).

Views Helps SPIE Sud-Est:

Deploy an open, standardized modular system.

Streamline implementation using pre-built GUI components.

Adapt to change while maintaining consistency.

“While it is a fundamental part of the system,

Visualization Server is hidden from the users. They don’t know it’s there. It’s so good, they don’t have to know.”


Optimizing Transportation Networks

SPIE Sud-Est is a key partner in the pan-European OPTICITIES project, an initiative to optimize transportation networks. Their mission is to help European cities tackle complex urban mobility challenges. As a participant in this initiative, SPIE Sud-Est addresses multi-modal real-time traffic control, real-time information, and strategic decision support tools for the Lyon, France metropolitan traffic system. This covers 1,360 km of roads, 7,300 intersections, and peak traffic of 172,000 vehicles per hour.

Christophe Montano, account manager, explains the SPIE role in OPTICITIES, “We’re building the system to proactively generate predictions on traffic, moving us from a current reactive state. Our goal is to avoid or smooth congestion, better utilizing the capacity of the road network. This is especially important in urban areas, where space is a limited commodity.”

In fact, OPTICITIES cites a study indicating a 20% gain in road capacity with the optimization and prediction effort.

One example of this noteworthy project is CRITER, the effort to integrate prediction into the urban traffic management system for greater Lyon. Directing over 1,600 traffic controllers, 150 retractable bollards, 80 variable message signs, 600 video cameras, and 1200 measuring stations, CRITER is the epicenter of movement in the Lyon region.

The system coordinates increasingly dense traffic, more complex travel, and an ever-growing number of systems and devices. Managing this massive system requires ensuring always-on operation, implementing and upholding the individual cities’ transport policies, detecting and resolving unforeseen situations, as well as facilitating communication between local authorities.

Image Case Study SPIE Body 1
Image Case Study SPIE Body 2

Phased, Incremental Development Without Disruption

The SPIE team designed CRITER to be modular, with software elements deployed in an open, standardized way, also allowing for phased, incremental development without disruption.

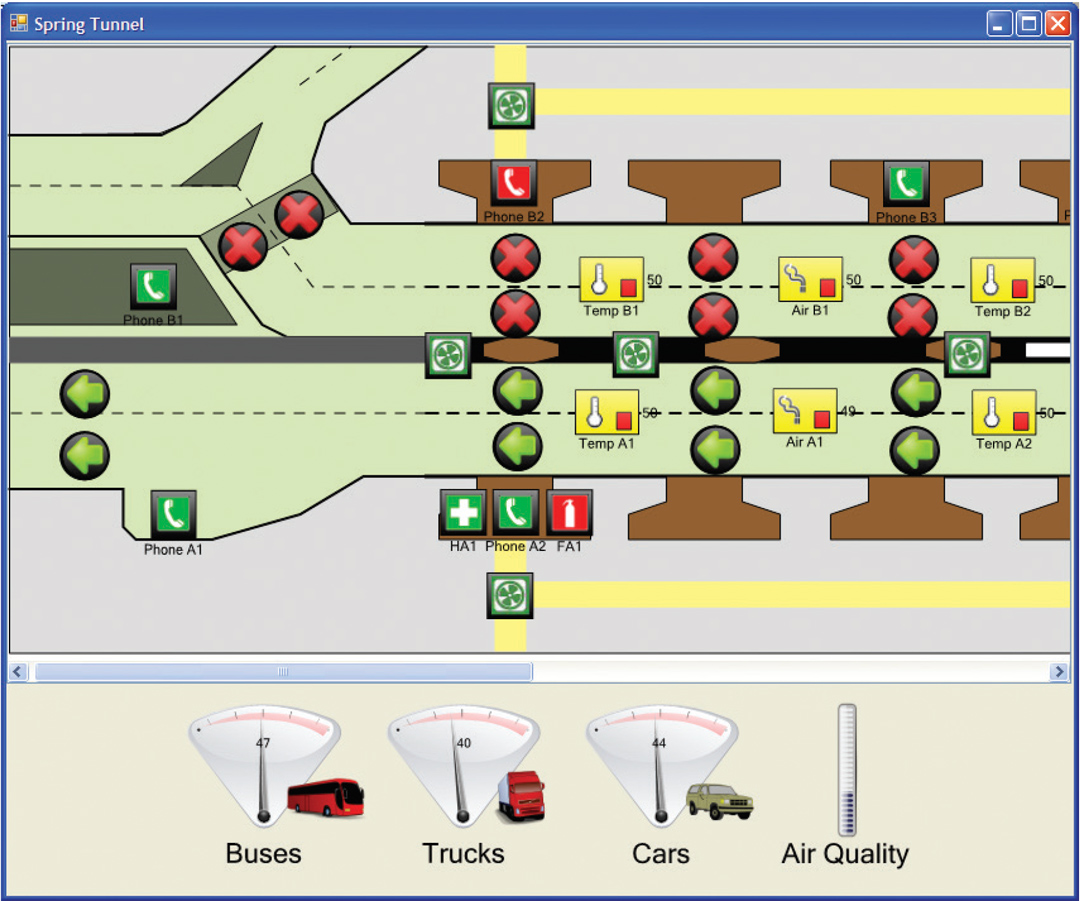
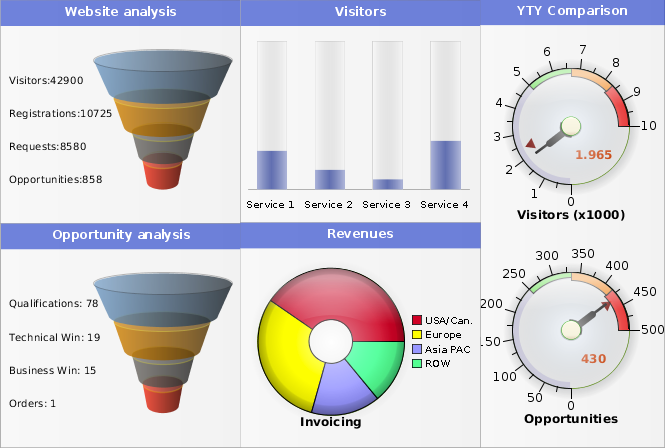
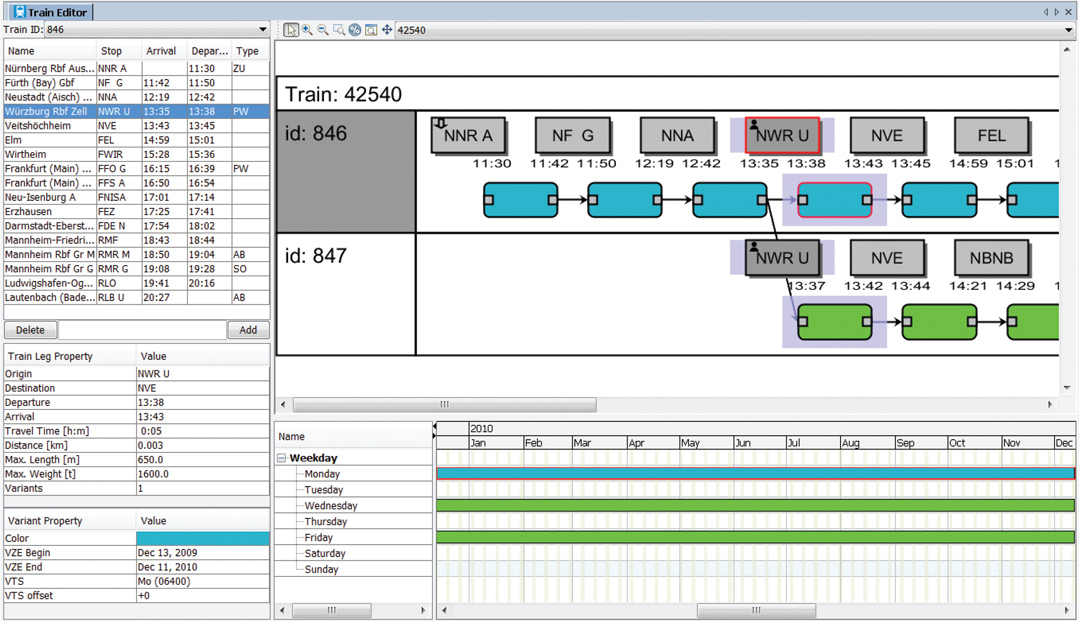
Enter Visualization for C++. A set of highly interactive, highly graphical displays, including both standard user interface controls, such as menus and buttons, as well as advanced maps, charts, diagrams, schedules, and schematics enable users to better model, monitor, and analyze information.

The SPIE team modeled the project using the Server component of Visualization, limiting the amount of time spent handling the back-end work. The Server framework represents GUI elements and topology as shared in-memory services. Frameworks can limit or interfere with deployment, but not so with Server.

Montano says, “While it is a fundamental part of the system, Visualization Server is hidden from the users. They don’t know it’s there. It’s so good, they don’t have to know.”

The SPIE team was careful to include end-users in the development process, as they would ultimately determine the system’s use and success. Fortunately, the development process was streamlined by using pre-built GUI components.

Montano explains, “Each town deploys their own solution, so we wanted to use technology that would allow us to deliver quickly, and give us downstream flexibility to adapt to changes. This way, we had the best of both worlds: Consistency across the solution and the ability to change as needed.

As expected, the implementation phase spanned six months to two years, depending on the size of the town. But regardless of the scale, in all cases, the SPIE team had consistent data, and a reliable system. Jonathan Robert, business manager, says:

 “With each implementation, we’re watching to see how the system behaves. And with each, there was consistent, predictable behavior. In this project, with its many pieces and differences, that is success.”

With an ever-changing transportation management system, there are bound to be hiccups along the way. This is where vendor support comes into focus.

Montano explains, “We work with many vendors, with varying levels of service and expertise. I can say that Perforce (formerly Rogue Wave Software) and its Visualization experts are very, very good.”

The SPIE view of a city is as a living, breathing organism, shared by cars, vans, buses, trams, bicycles, and pedestrians. The right system creates vibrant, free-flowing circulation, seamlessly coordinated by a multimodal transport application. By applying smart architecture and the right components, the SPIE team manages transportation in all its flavors to handle today’s challenges and predict tomorrow’s.

C++ Visualization With Views

Views software provides C++ visualization tools to build high-performance, interactive, advanced graphical displays for desktop and web applications.

Contact us today and speak with an expert about getting started with Views C++ visualization software.

Speak to an Expert