Why TotalView Is the Leading HPC Debugger for Complex, Multithreaded Applications
-
Capabilities
Advanced Debugger
Basic Debuggers
-
Capabilities
-
Breakpoints and source display
-
Command line interface
-
Memory debugging
-
Reverse debugging
-
Full control over all process threads
-
Debugging two or more processes simultaneously
-
Graphical display of array data
-
Debugging C++ code with heavy template use
-
Complex data structure insight
-
Use Barrier points to synchronize threads
-
Dynamically insert new code down to the thread level with evaluation points
”We rely on TotalView for all of our parallel debugging needs.”
David Gunter | Parallel Tools Team | Los Alamos National Laboratory
Featured Video
Watch a Multithreaded Program Debugging Session
See how easy it is to analyze and control threads, and set thread-level breakpoints, using TotalView.
Image

Multi-Core and Multithreaded Program Development
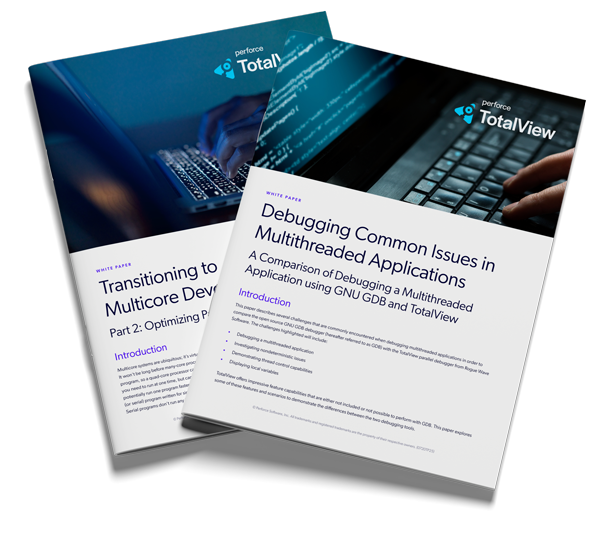
Transitioning applications to run on multicore systems is easier with an advanced debugger that can give you big-picture and detailed views of multithreaded, highly parallel code.
Download this two-part white paper — Transitioning to Multicore (Part 1) and Transitioning to Multicore Development Part 2 — to improve your application’s performance.
