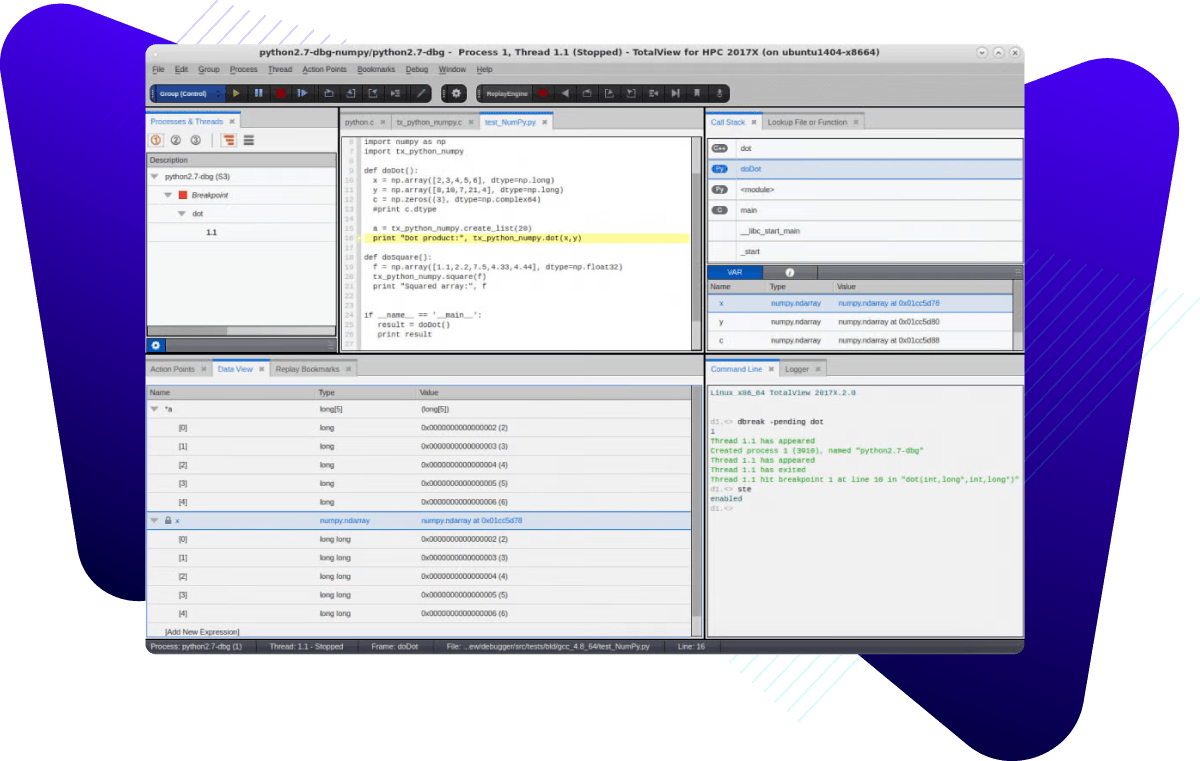
The Most Advanced Debugger for HPC
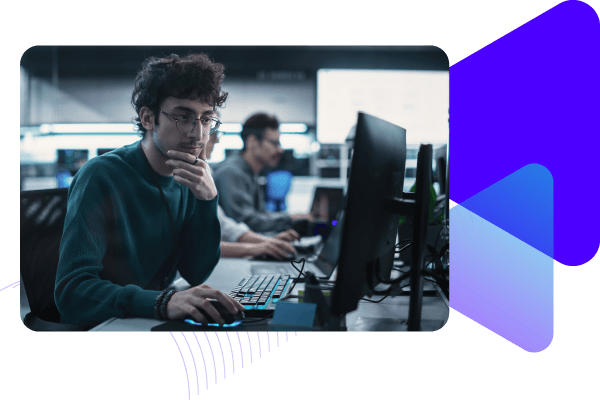
Building complex multithreaded, multiprocess, and GPU-specific applications is hard. Finding and fixing bugs in them can be even harder. TotalView is a powerful debugging solution that meets the unique and demanding requirements of HPC developers.
With Perforce TotalView, you get the advanced debugging features you need to:
- Quickly understand how complex, parallel code is running in your application
- Scale from desktops to the world’s largest supercomputers
- Easily debug HPC parallel technologies including MPI and OpenMP
- Simplifying debugging NVIDIA or AMD GPU code
- Find memory leaks, buffer overruns, and other memory issues
- Debug complex C, C++, Fortran and Python code
Advanced HPC Debugging Features
Complex code? No problem. With TotalView, you get the comprehensive features you need to:
Simplify HPC Debugging
Easily resolve issues in highly parallel and multithreaded C, C++, and Fortran code running across clusters and sites with TotalView.
Streamline GPU Debugging
TotalView enables scalable debugging of single to multiple nodes of NVIDIA GPUs running CUDA and OpenACC and AMD GPUs running HIP.
Powerful Debugging Features
Find memory leaks that plague your application and buffer overruns that create security issues. Use reverse debugging to quickly solve critical bugs. Simultaneously debug Python code that is combined with C and C++.
"We rely on Perforce TotalView for all of our parallel debugging needs. Its scalability, multi-language support, and built-in debugger make it an indispensable tool for us."
Trusted Across Industries for Debugging Complex Code
Perforce TotalView is relied upon to debug complex code in many industries, including:
- Research labs
- Higher education
- Oil & gas
- Computer animation
Pushing HPC Boundaries Across Industries With TotalView
Researchers need the most advanced HPC technologies to increase understanding and drive innovation in areas such as precision medicine, weather modeling, and astrophysics. Debugging cutting-edge HPC applications requires highly specialized and modern tools that support the latest hardware and software approaches.
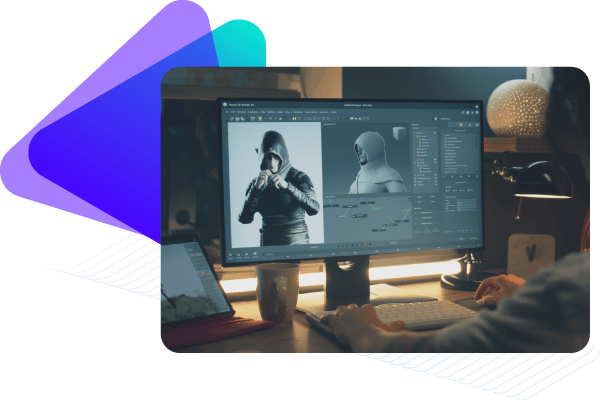
To meet demanding timelines and ensure smooth, real-time sequences, animators need to rapidly debug their 2D animations and 3D models.
Many animators use Maya for rendering. One of its many strengths is that it can be easily extended through Python extensions, many which are written through Pythons C++ module capabilities to provide high-performance rendering routines. Using Maya increases flexibility however, it also creates a very complex debugging environment.
Rather than working with multiple debuggers to debug Maya's Python and Python extension C++ code, use one: TotalView. From the same, intuitive interface, you can analyze call sequences and data transfer across Python and C++ barriers — plus fully debug your C++ code.
Animation studios are leveraging OSL through applications such as RenderMan to generate advanced, high-performance 3D renderings. Behind the scenes, OSL uses advanced Just-In-Time (JIT) compilation features provided by the LLVM compiler to drastically speed renderings. However, debugging JIT code is problematic if the debugger can't hook into the on-the-fly generation of code-debug symbols.
TotalView automatically discovers and debugs new JIT code in an OSL application, even if it’s automatically generated during rendering. So, you can accelerate debugging with TotalView — and use it to significantly speed development with OSL.
The code that supports computer animation pipelines and renderings is complex, which makes it especially challenging for new software engineers to learn.
Using TotalView’s reverse debugging technology, engineers and animators can quickly analyze code running within pipeline and computer animation processes to:
- Learn how it works.
- Form development strategies.
- Understand the interaction between threads and processes.
- See where changes can boost application performance.
Professors, researchers, and students use TotalView because it delivers the leading HPC debugging tools as well as services that meet the unique requirements of higher education institutions.
By using TotalView to ensure their HPC applications are highly reliable and using memory resources as effectively as possible, researchers, professors, and students can study and advance our understanding of disciplines, including:
- Genomic research, to develop more effective cancer treatments using precision medicine.
- Astrophysics, to better understand our universe using 2D and 3D simulations.
- Meteorology, to model climate change, including causes that impact life.
HPC researchers and developers need to know how to debug their code. Many of our higher education customers use TotalView to teach HPC debugging because it can be used to:
- Step forward and backward through code execution to illustrate fault isolation, memory leak detection, and other critical skills.
- Easily record debugging sessions for lessons.
- Create debugging exercises by recording HPC application’s execution, including memory usage and thread context switches.
- Save time for students since the TotalView GUI interface is so easy to use.
- Take advantage of complementary services that come with some licenses, such as training for HPC debugging instructors.
When researchers, professors, and students at universities are new to an existing HPC project, they need to rapidly understand how the code works. With reverse debugging in TotalView, they can quickly gain the detailed insight needed to:
- Understand HPC applications’ logic.
- See how algorithms aggregate data and calculate equations.
- Gain insight into code written in multiple languages including Python, C, and C++.
- Debug MPI, OpenMP, and CUDA code to learn how to build complex applications.
Most HPC developers at universities collaborate with teams at other sites and institutions, which involves sharing HPC resources and applications. When one university has a TotalView Educational Site license, it can:
- Specify who can access TotalView, even if they work at a different site or institution, because the license is based on token usage.
- Boost efficiency by avoiding slowdowns caused by multiple debugging tools or limits around who can debug code.
Time is money — even in higher education. HPC researchers, professors, and students must efficiently utilize time on universities’ HPC clusters.
TotalView's easy-to-use interface and advanced features such as Reverse Connect enable efficient HPC debugging workflows, making it easier and faster to learn code and solve problems. In addition, TotalView provides educational site licenses and training packages to simplify TotalView adoption across your HPC facilities and affiliated educational sites.
As non-profit organizations, higher education institutions have limited budgets. TotalView provides special licenses and discounts for global higher education institutions and students. Options include licenses based on the number of users, desktops, departments, and sites.
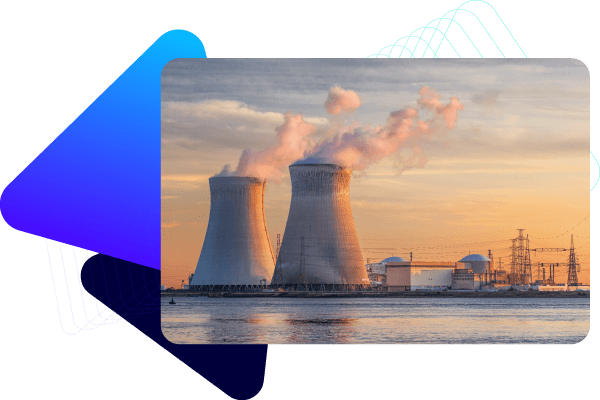
Oil and gas modeling software is rapidly growing in size and complexity to take advantage of clusters' CPUs and GPUs. Developing and debugging these applications — which often have hundreds of millions of lines of code plus a complex web of shared libraries, arrays, threads, and processes — can be challenging, unless you have TotalView.
Finding gas and oil deposits in less time is possible with fast, highly reliable HPC applications. Speed development cycles, boost response times, and reduce downtime by using TotalView. With it you can:
- Quickly analyze code to pinpoint data and logic errors and identify areas for optimization in highly complex HPC applications.
- Easily view the state of your entire job and examine data in any process to verify accuracy — even in massively parallel and scalable applications.
- Easily debug MPI, OpenMP, and CUDA code running on CPUs and GPUs across clusters.
Developing and managing 2D- and 3D- objects, models, and simulations involves added complexity, including multidimensional array management.
With TotalView, you can easily view, slice, and filter your arrays — and view comprehensive statistics about arrays — so you can create the visualizations needed to expedite gas and oil discovery.
With TotalView, you can easily establish interactive debugging connections even on complex, multi-tiered architectures. That's because when jobs run, the built-in Reverse Connect capability automatically connects the backend job with the TotalView user interface, so no lengthy, manual management is required.
Get Started With Perforce TotalView
Fill out the form to speak with an expert about HPC debugging.